The Partnership for Observation of the Global Ocean (POGO) was founded in 1999 by directors of oceanographic institutions around the world as a forum to promote and advance the observation of the global ocean. POGO is a UK-registered charity with member institutions from around the world, and works closely with other international and regional programmes and organisations.
POGO seeks to expand international support for ocean observing, through innovation of the ocean observing system, capacity development and outreach/advocacy.
Ocean Scientists in the UK and USA are using complex arrays of moored sensors to monitor the Atlantic Meridional Overturning Circulation (AMOC)
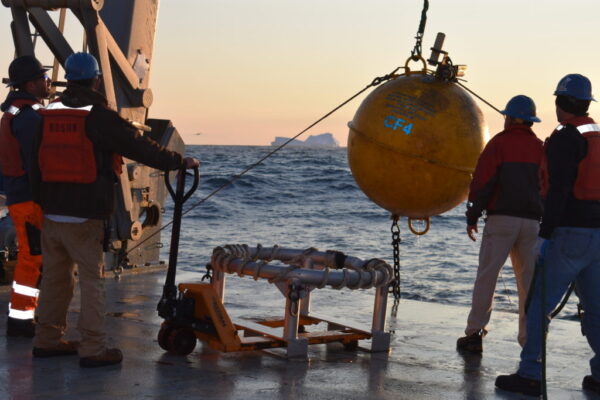
Recovering the flotation sphere for mooring CF4 with an iceberg in the background. Pictured from left to right: Andrew Davies, Pete Liarikos, John Kemp and Brian Hogue. Photo by Isabela Alexander-Astiz Le Bras
The Atlantic Meridional Overturning Circulation (AMOC) is an intricate tangle of streams that transports water and heat poleward, like a colossal subsurface river, before it cools, sinks, and returns southwards along ocean valleys and basins. The AMOC is essential in regulating the Earth’s weather and climate and helps to keep northern Europe relatively mild; contributes to rainfall patterns in the Amazon, the Sahel, and the Bay of Bengal; and controls sea levels on the US Atlantic coast.
Scientists once thought that changes in the AMOC happened gradually, over millennia.
But studies of seafloor sediments turned this assumption on its head, revealing that the system of currents has, on occasion, slowed dramatically over the course of decades during the most recent period of deglaciation (roughly 21,000 to 8,000 years ago). And when experts studied two snapshot estimates of water and heat transport made using observations taken by major hydrographic surveys of the AMOC conducted between 1957 and 2004, they were alarmed to see that the current system appeared, once again, to be in decline.
Some feared that human-driven impacts such as global heating could be creating conditions that might cause the AMOC to slow down or stop altogether, and that could have devastating implications for the planet’s weather, climate, and ecosystems. But because the speed of the AMOC also fluctuates naturally, researchers recognised an urgent need for direct, comprehensive, long-term observations to characterise the system of currents and tease apart natural rhythms from anthropogenic changes.
So in 2004, the UK’s National Oceanography Centre (NOC) and the University of Miami launched an ambitious initiative to continuously monitor the AMOC called the Rapid Climate Change programme (RAPID).
At the project’s heart is a remarkable array of sensors anchored to the seabed in the subtropics between the Canary Islands and Florida.
RAPID is complemented by the more recent Overturning in the Subpolar North Atlantic Program (OSNAP), which followed ten years later, and is located in the subpolar North Atlantic with mooring line connecting Scotland, Greenland, and Labrador.
These remarkable sensor arrays are providing the observations needed to monitor changes in currents and uncover some of the AMOC’s biggest secrets.
Understanding the AMOC
The Intergovernmental Panel on Climate Change (IPCC) predicts that if human greenhouse gas emissions continue unchecked, the AMOC will weaken by as much as one-third by the end of the century. “While the system is not yet predicted to completely shut down, all it could take is a weakening for it to cause all sorts of extreme events around the globe,” says Alejandra Sanchez-Franks, a senior scientist at the NOC, based in Southampton, UK.
Rather than standalone seas, the global ocean is interconnected through currents, gyres, and eddies, some of which transport water, heat, and nutrients from the tropics to polar regions and back again. The AMOC forms the North Atlantic-leg of this global system, transferring enough energy north to meet the needs of humankind fifty times over. “The AMOC’s speed is heavily influenced by changes in temperature, salinity, and winds, but because continuous observations only span a few decades, there are still a lot of unknowns,” says Sanchez-Franks.
“What state of health is the AMOC currently in? How might the system of currents respond to global heating? How will these changes affect weather and climate patterns? What tipping points do we need to be aware of? We can answer these questions through ocean observations. The more we measure, the better we’ll be able to narrow down uncertainties, understand what the AMOC is doing, and learn what a weakening will look like.”
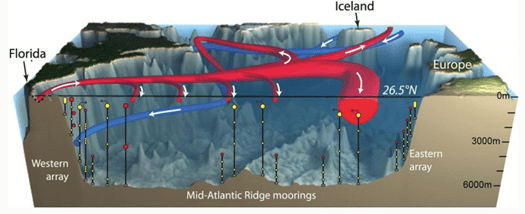
Fig 1
Since 2004, RAPID has continuously observed the AMOC across the Atlantic Ocean at roughly 26°N, while since 2014 OSNAP has monitored subpolar regions at 53°N. Together they are helping to characterise the size of the AMOC’s flows, shine light on its natural variability, and understand how it is changing.
“The ocean absorbs more than 90 percent of excess heat caused by human-driven climate change and more than a quarter of excess carbon emissions: some of these are taken down by this big circulation system when waters grow dense and sink in the polar regions,” says Ben Moat, a senior scientist at NOC and principal investigator on RAPID. “But at the same time, ocean waters are warming and the Arctic is awash with meltwaters from ice sheets and glaciers. Warmer, fresher waters are making the ocean’s surface layers less dense.
Some scientists believe this has weakened the AMOC, conclusions that are backed up through direct ocean observations and studies of natural archives of Atlantic current activity such as ocean sediment and ice cores. “The role of human-impacts in this slowdown remains to be seen: at the moment observations do not extend far enough back in time to tease apart all natural variability from anthropogenic changes,” says Moat. “Yet with every haul of data, scientific teams are learning new aspects about how the AMOC is fluctuating on timescales of days to decades.”
One of the most startling findings came shortly after RAPID was launched. “It was known from studies of ice cores and seafloor sediment that the AMOC fluctuates markedly on yearly and decadal timescales, but much to our surprise the currents also vary wildly on a daily basis by as much as five sverdrup – where one sverdrup is equal to one million cubic metres of water per second,” Moat explains. “Such a fundamental discovery allows us to improve climate models and supports predictions of future changes in the AMOC. But it also highlights how much there is still to discover.”
Each of RAPID’s 10 necklace-like moorings is anchored to the seabed, featuring long, sturdy metal wires studded with more than 200 instruments in total (around 20 to 30 on each mooring) that take measurements of salinity, temperature, pressure, oxygen levels, and the speed of ocean currents at different depths. In some cases the arrays span more than five kilometres from the seabed to the near surface. Every year, teams from the NOC journey to each site, retrieving the data and replacing the arrays with newly-calibrated equipment.
“To get each mooring in place requires detailed knowledge of the ocean environment and seafloor,” says Moat.
“Glass and foam spheres help the arrays maintain buoyancy and keep the whole system in place. The equipment needs to be hardy enough to survive hostile environments such as the deep ocean. Sometimes an instrument may get damaged: we need to do everything we can to preserve the precious data.”
But despite the logistical challenges of operating an ocean-wide, ocean-deep programme, efforts are paying off. Observations taken by RAPID are helping researchers shine light on some of the AMOC’s biggest secrets, including its variability, roles in heat transfer into the deep ocean, and connections with unusual weather patterns.
“In the winter of 2009-10, a surprise weakening of the AMOC coincided with long periods of bitterly cold weather in northern Europe, an event that caused numerous deaths and widespread disruption to transport,” Moat says. “Observations taken by RAPID showed that the AMOC had (temporarily) lost around 30 percent of its strength. A weakened AMOC means less heat is transferred to higher latitudes. Analysis of RAPID datasets, combined with other observations from satellites and Argo floats indicate that the weakening of the AMOC contributed to this very cold weather.”
That was not all. North of New York City, sea levels rose by nearly 13 centimetres, causing widespread flooding and coastal erosion – a direct effect of less water flowing away from the US Atlantic coast as a result of a slowdown in the currents. And, because less heat is transported northwards, more of it remains in subtropical regions, which Moat says could also have implications for the formation of hurricanes.
“At the moment researchers can only observe short-term changes in the AMOC in hindsight, after data is retrieved during voyages,” Moat says. “However, we are testing ways that can enable retrieval in near-real-time via a satellite link. Eventually, this could support the forecasting of extreme climate events and changes in sea levels. Authorities could then prepare ahead of time and not be caught so unawares.”
Characterising flows across the ocean
RAPID’s observations in the subtropical North Atlantic open up as many fascinating questions as they help answer. How much of the water and heat passing through subtropical latitudes is reaching the subpolar regions? What is the AMOC’s strength as it approaches the Arctic? Where exactly are the key sinking events happening? To answer these questions, OSNAP was deployed in 2014 covering two sections: one in the Labrador Sea between Canada and Greenland and another in the seas between Greenland and Scotland. Since its first harvest of data, the array has provided crucial insights into the inner workings of the AMOC.
“When OSNAP went into the water, it was thought that the majority of the AMOC’s essential ‘overturning’ was a result of convection activity happening in the Labrador Sea, to the west of Greenland,” says Sanchez-Franks. “But analysis of OSNAP observations found that, rather, most of the sinking happens to the east of Greenland in the Irminger and Iceland basins. Every year that we build on these observations, we are potentially making discoveries that could completely change our perspective of how the AMOC works, as well as its impact on climate, ocean biogeochemistry, and other aspects such as sea ice cover.”
By combining data from OSNAP, RAPID, and other moored sensor array programmes, researchers can also investigate the degrees of connectivity between ocean regions and explore the intricate relationships that drive currents in different ways, at different times, in different parts of the ocean. “The key thing now is to build up these long-term datasets so that we can pull apart natural variability from human-driven impacts, and understand variability of the AMOC in context with other ocean and climate phenomena,” says Sanchez-Franks.
“This information feeds into climate models and informs future climate scenarios which can then direct policy decision making at regional and international levels. It can also help us to understand what a shutdown in the AMOC might look like and encourage response at an international level.”
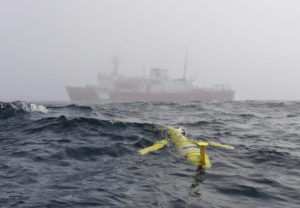
[Header image]: Photo by Isabela Alexander-Astiz Le Bras
[FIG 1]: The RAPID Array at 26degrees North in the North Atlantic Ocean measuring the Atlantic Overturning Circulation (AMOC). Water and heat move, across the equator, through the Caribbean, and is funnelled northwards past the east coast of North America. As the currents bend back across the Atlantic towards northern Europe, one arm heads southwards back towards the equator and the other heads in the direction of Iceland. Here, the waters cool as heat is transferred to the atmosphere. Evaporation also occurs, increasing the water’s salinity. Dense with cold and salt, at subpolar latitudes the waters ‘overturn’ and sink deep into the ocean before spreading back south.
[FIG 2]: OSNAP’s densely spaced mooring arrays and Ocean gliders measure temperature, salinity, and ocean current speed and direction. Data are combined with Argo profiling floats, satellite altimetry, and measurements of ocean surface wind speeds. The data is enabling researchers to directly characterise subpolar regions of the ocean. Photo by Robin Matthews

 Climate-critical observing